Block Analysis
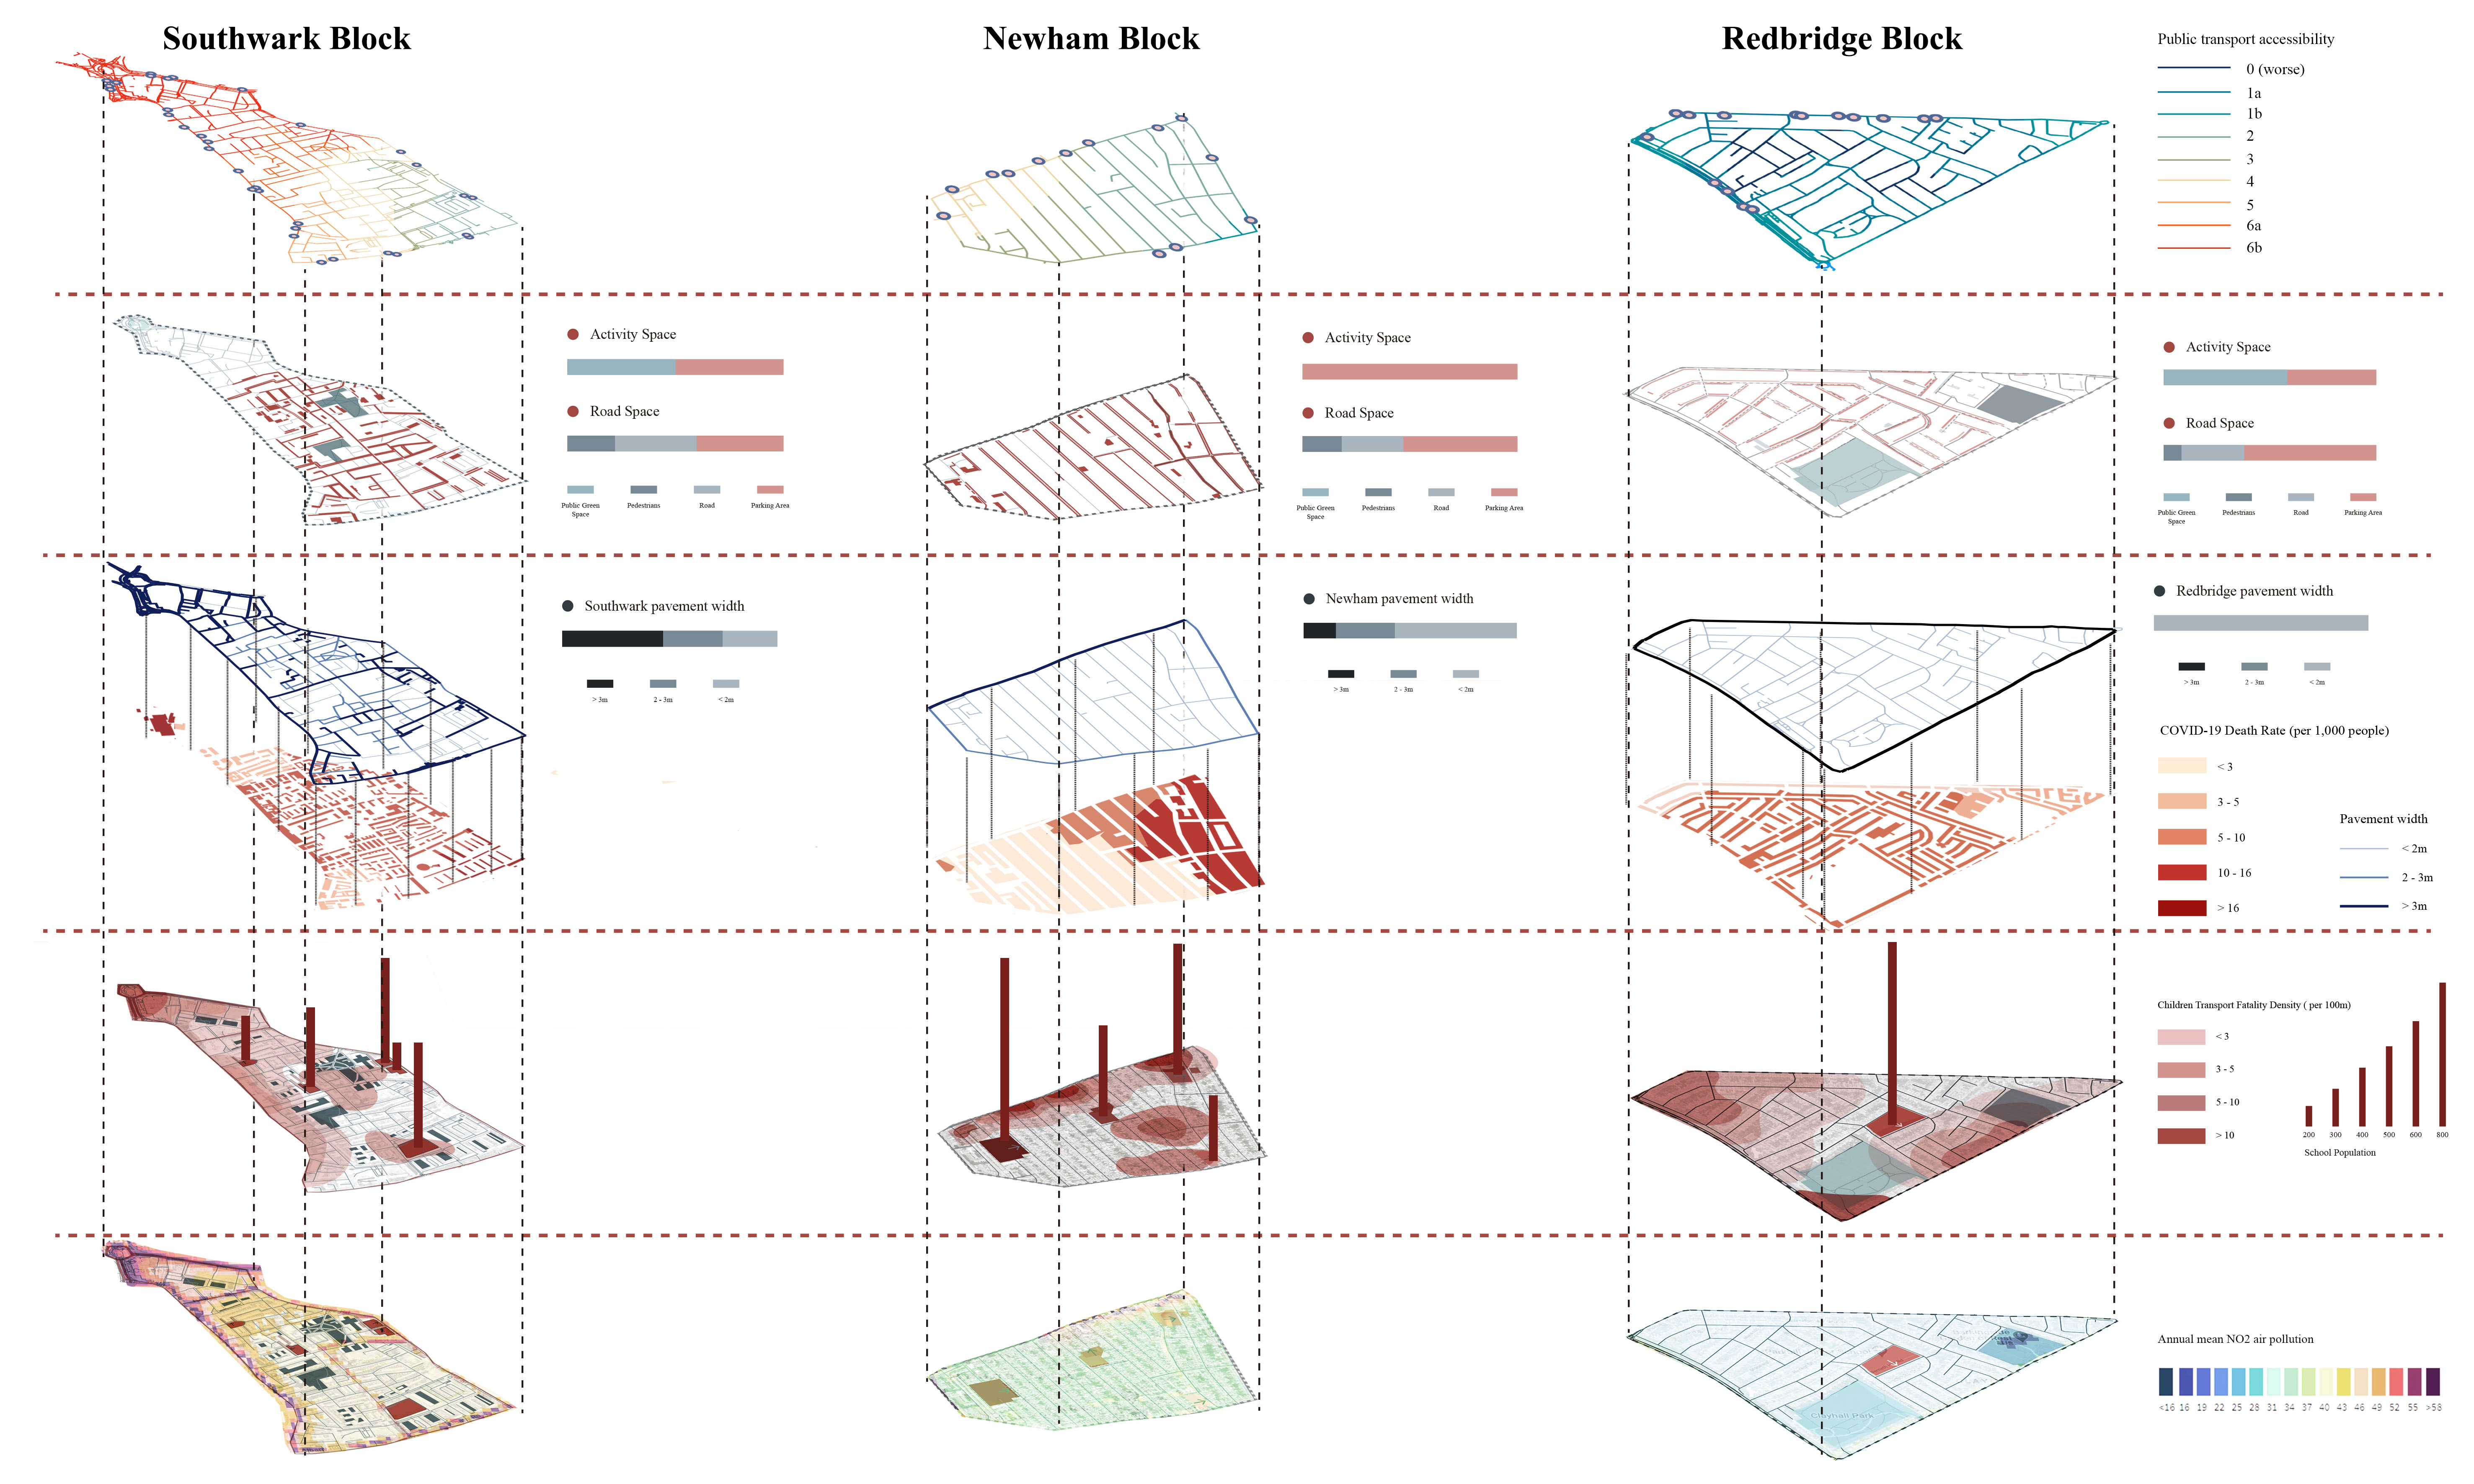
We investigated the three blocks due to its location within lower income areas. Mainly based on COVID-19 death rate and car ownership issues, we chose the other two blocks.
The first block is located in Southwark borough with better situation, second block is in Newham with highest COVID-19 death rate, third block is in Redbridge borough with highest car ownership. Each block was chosen based on existing bus routes, and was highlighted by red square.
We analysis the public transport accessibility level, we can see the PTAL score is decreasing from inner london to outer london, people who lives in outer London will have to face inconvenient transport situation.
By comparing the three blocks, we can know that Southwark is in a better situation, it has highest public transport accessibility, more green spaces, wider pavement width, less students in each schools, but only higher air pollution. Issues in Newham has highest COVID-19 death rate, no green space, narrower pavement width. For the redbridge, poor public transport accessibility cause higher car ownership, more students in that school can cause congestion, and there is no pavement meet the requirement for pedestrian to keep social distance. So our design will have slightly differences based on those different situations.
